
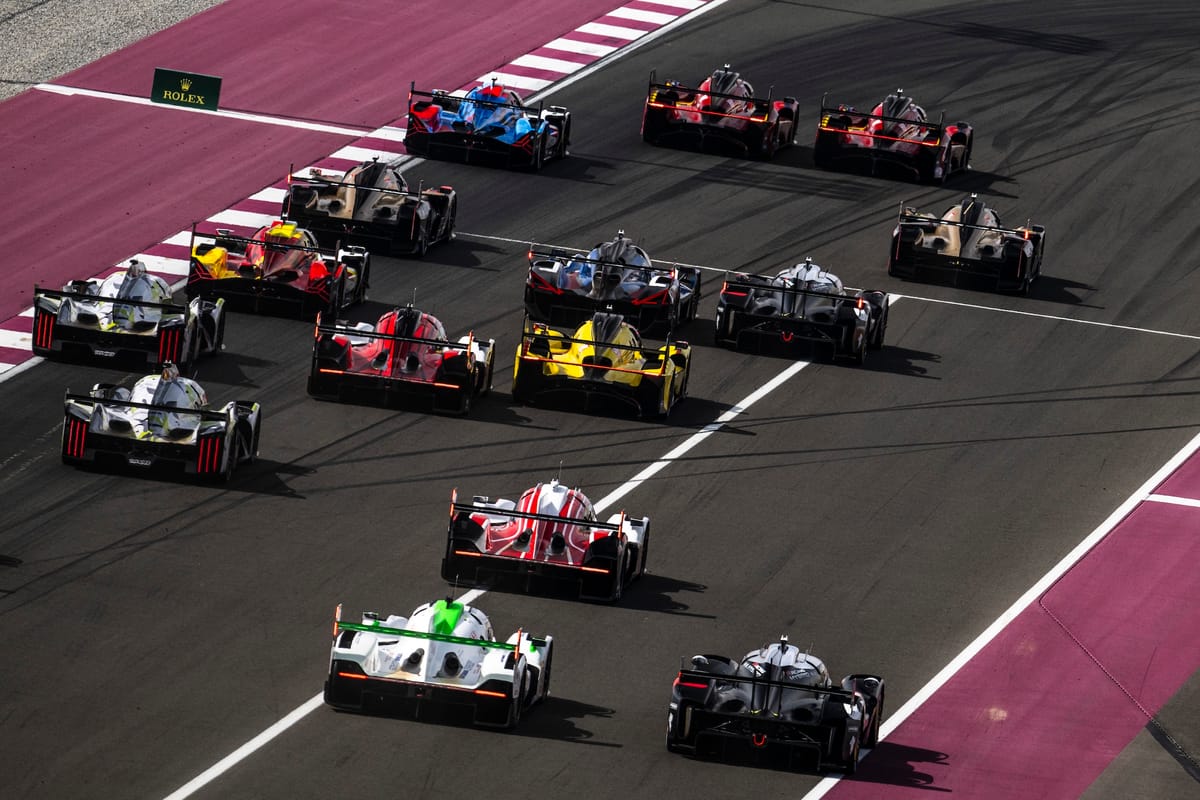
Sebring is just around the corner — exciting stuff! The race is truly unique, on a surface like no other in world motorsport and a race that can literally cause cars to fall to pieces.
IMSA has released the Balance of Performance tables, so let's examine where we are and see if we can make any early predictions about the order in Florida next weekend.
Weight
Power
Energy per stint
Power to weight
Power to weight is how you can really make some kind of sense of balance of performance.
As we can see, compared to Daytona, the biggest losers here are Acura. They had amongst the best power to weight among the four main contenders at Daytona (not counting Lamborghini...) but they've been nerfed for Sebring.
Why? Because they've lost 22kW of power since the 24 hour race in January, while also gaining 7kg in weight. BMW have also lost out in the power to weight, having lost 8kW of power.
We've also included values from the Sebring test, which was held last month. This shows that Acura lost 20kW of power for that, and have lost a further two 2kW for the race weekend.

Cadillac, meanwhile, have done rather well, at least compared to Daytona. They've gained a little bit since then, although have been nerfed since the Sebring test.
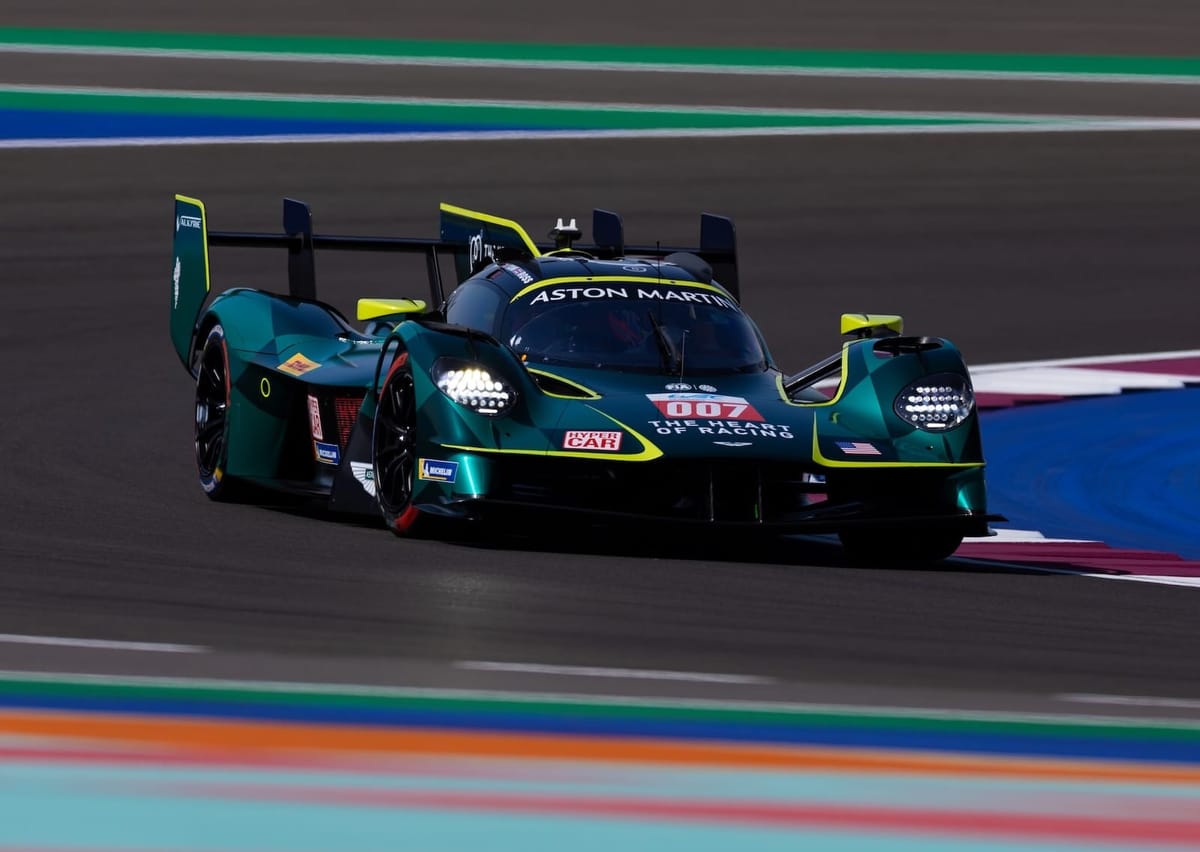
Porsche run an almost identical power to weight compared to Daytona, after being given a boost for the test. Meanwhile, new boys Aston Martin have the second-highest power to weight, although this has come down since the test, having lost 9kW of power. That said, they've also lost 12kg in weight, so... swings and roundabouts.
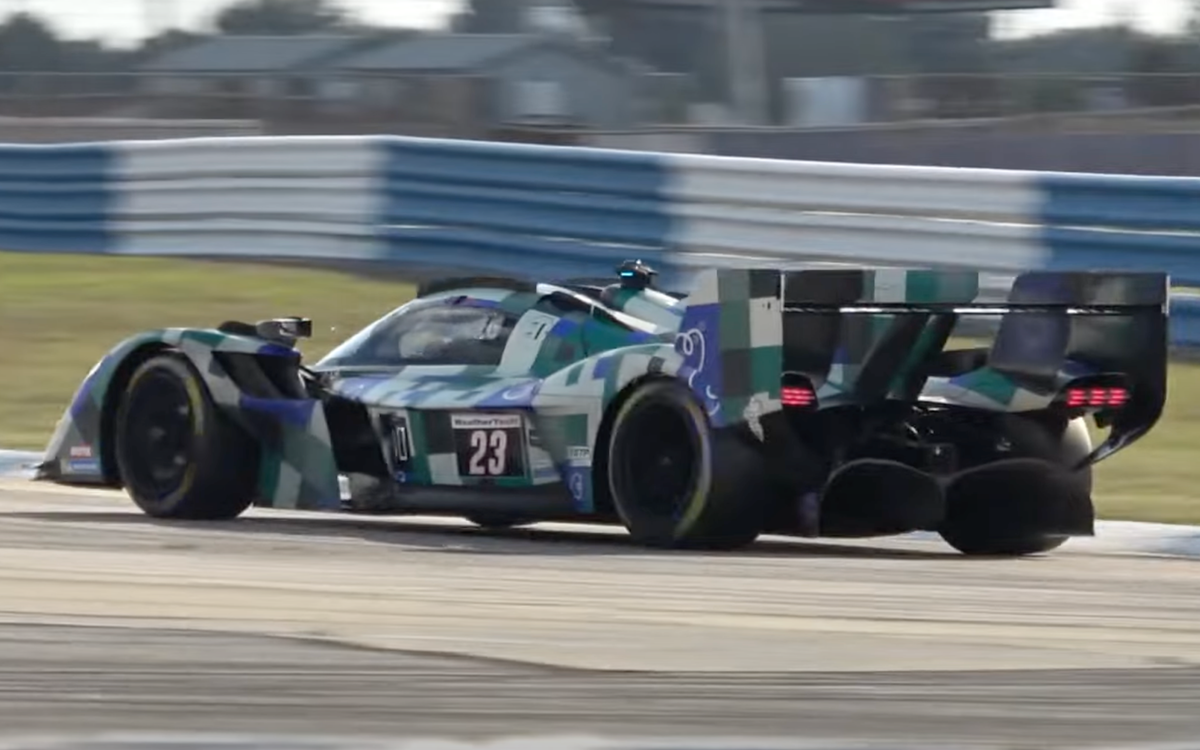
Lamborghini are the only team to have gained in the power to weight chart compared to the test. They'll run an almost identical power to weight ratio as they did in Daytona, just 0.001kW/kg down.
Why have the changes been made?
Let's examine, for a minute, why these changes may have been made, both since the last IMSA race at Daytona, and since the Sebring test.
Below is each team's average and best average lap times from Daytona. To explain briefly the methodology here: to calculate the average we've calculated each car's average across the race, then added the values for each team together to create an overall team average. For the best average, we've taken each team's best car average from the race to display.
If it's got a black line around it, it's the best lap time. If it's slightly opaque with a white line around it, it's the average from all cars from that manufacturer.
As you can see, in both metrics when comparing Porsche, BMW, Acura, and Cadillac, Cadillac came out worse. That said, the best average wasn't that far off Acura, but they were slower, even by a whisker.
This, then, makes sense why they were given a decent break for the Sebring test, although so were Porsche, the quickest team at Daytona across both metrics. As already discussed, Acura lost quite a bit for the Sebring test, as did BMW, although not nearly as much as Axura.
Now let's look at the Sebring test, using the same methodology as above.
The picture has now changed, with all three main contenders much closer together on pace in both metrics. In terms of best averages, Porsche lead, followed by Cadillac, followed by Acura, with BMW the slowest of the four. Between Porsche, Cadillac, and Acura, there's just a smidge over two tenths between all three.
The same order is true of averages from all cars from each manufacturer, although the gap between the top three is bigger, standing at just under four tenths. In relative terms, that's still small considering that's an average from five sessions at the Sebring test.
Lamborghini are fourth quickest, followed by Aston Martin, who with a new car are, understandably, slowest.

What does this mean for the race?
Everyone except Lamborghini have lower power to weight ratios than at the Sebring test, essentially.
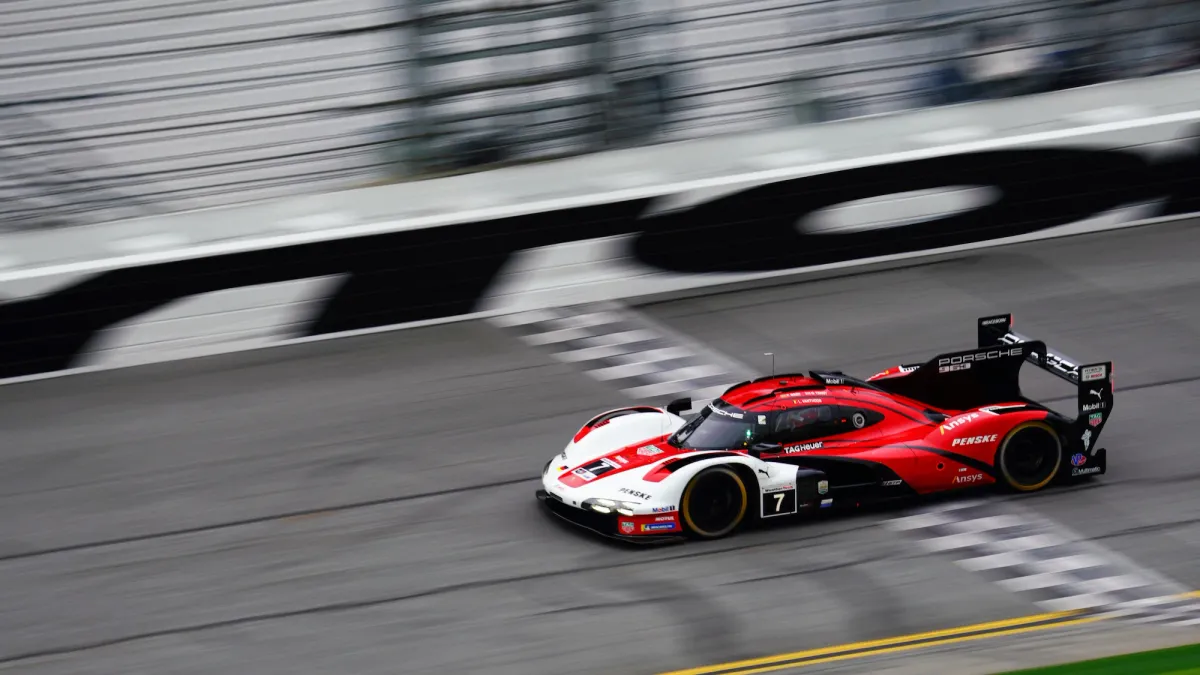
Cadillac and Porsche lose the same amount in terms of power to weight ratio, both losing 0.008kW/kg. The way they lose that is different though — Cadillac are given 5kg of extra weight while losing 6kW of power, while Porsche's weight drops 2kg but lose 9kW. In the end it works out as 0.008kW/kg lost for both.
Acura lose 0.005kW/kg, while BMW lose 0.003kW/kg. Aston also lose 0.005kW/kg, while Lamborghini actually gain 0.001kW/kg. Good for them. Let's hope they have a chance to use it... unlike at Daytona.
A very quick word, too, for energy per stint. Lamborghini have lost 12MJ since Daytona, while everyone else has lost some since the Sebring test.
Predictions? It's hard to really say given teams almost certainly were not pushing at the test. It's going to be close, but I think Porsche will be the strongest. However, as we've seen countless times at Sebring, often pace doesn't matter, with reliability and keeping it on track taking much greater precedence at the old airfield.
We'll be back with long run pace analysis from the practice sessions next week. Catch you then.
Feature image: Kevin Dejewski
This post is brought to you by The Racing Line, your personalised motorsport calendar app. Get session times for over 150 series, from rally to bikes, single seaters to sportscars with customisable notifications and built-in streaming. Download on iOS today!